Expense Tracker
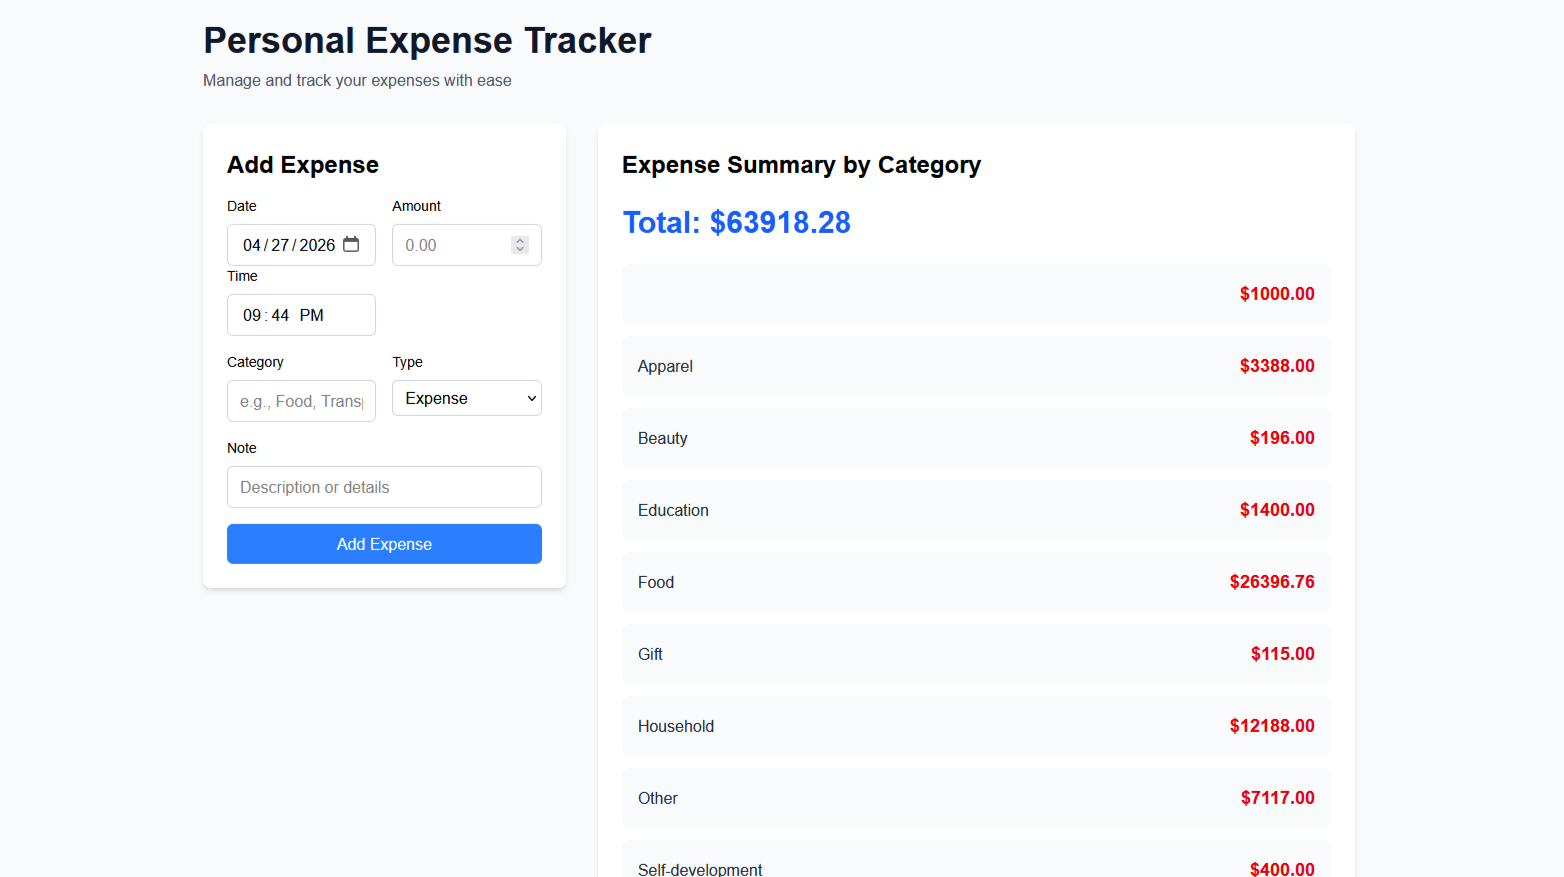
A full-stack web application for tracking, categorising, and visualising personal expenses and income — built with a Next.js frontend and a Flask REST API backend, with data stored in a lightweight CSV file.
CSV
Zero-DB Storage
Chart
Visual Breakdowns
REST
API Architecture
100%
Self-hosted
About the project
What is the Expense Tracker?
Most expense trackers are either too simple or too bloated. This one sits in the sweet spot — a clean UI for day-to-day logging paired with just enough visualisation to actually understand your spending.
The backend is a Flask REST API that reads and writes to a CSV file, making it trivially easy to self-host, inspect raw data, or export for further analysis in Excel or Python.
The frontend renders interactive charts for monthly trends, category breakdowns, and income vs. expense comparisons — all updated in real time as you add or edit entries.
Tech Stack
Details
- TypeFull-stack Web App
- RoleSolo Developer
- StatusLive
Features
What it can do
Add Transactions
Quickly log expenses or income with a category, amount, date, and optional note.
Categories
Organise spending into custom categories — food, rent, entertainment, and more.
Pie Charts
Category breakdown charts show exactly where your money goes each month.
Trend Lines
Monthly income vs. expense line charts help you spot saving patterns over time.
CSV Export
Download your full transaction history as a CSV — ready for Excel or Python analysis.
REST API
Flask backend exposes clean endpoints — easy to extend or hook into other tools.
Workflow
How it works
Log
Add an expense or income entry with category and amount.
Organise
Entries are saved to CSV and grouped by category/month.
Visualise
Charts update instantly to reflect your current data.
Export
Download your data anytime for external analysis.
Want to see the code?
The full source — Flask API and Next.js frontend — is on GitHub. Fork it, run it locally, and make it yours.